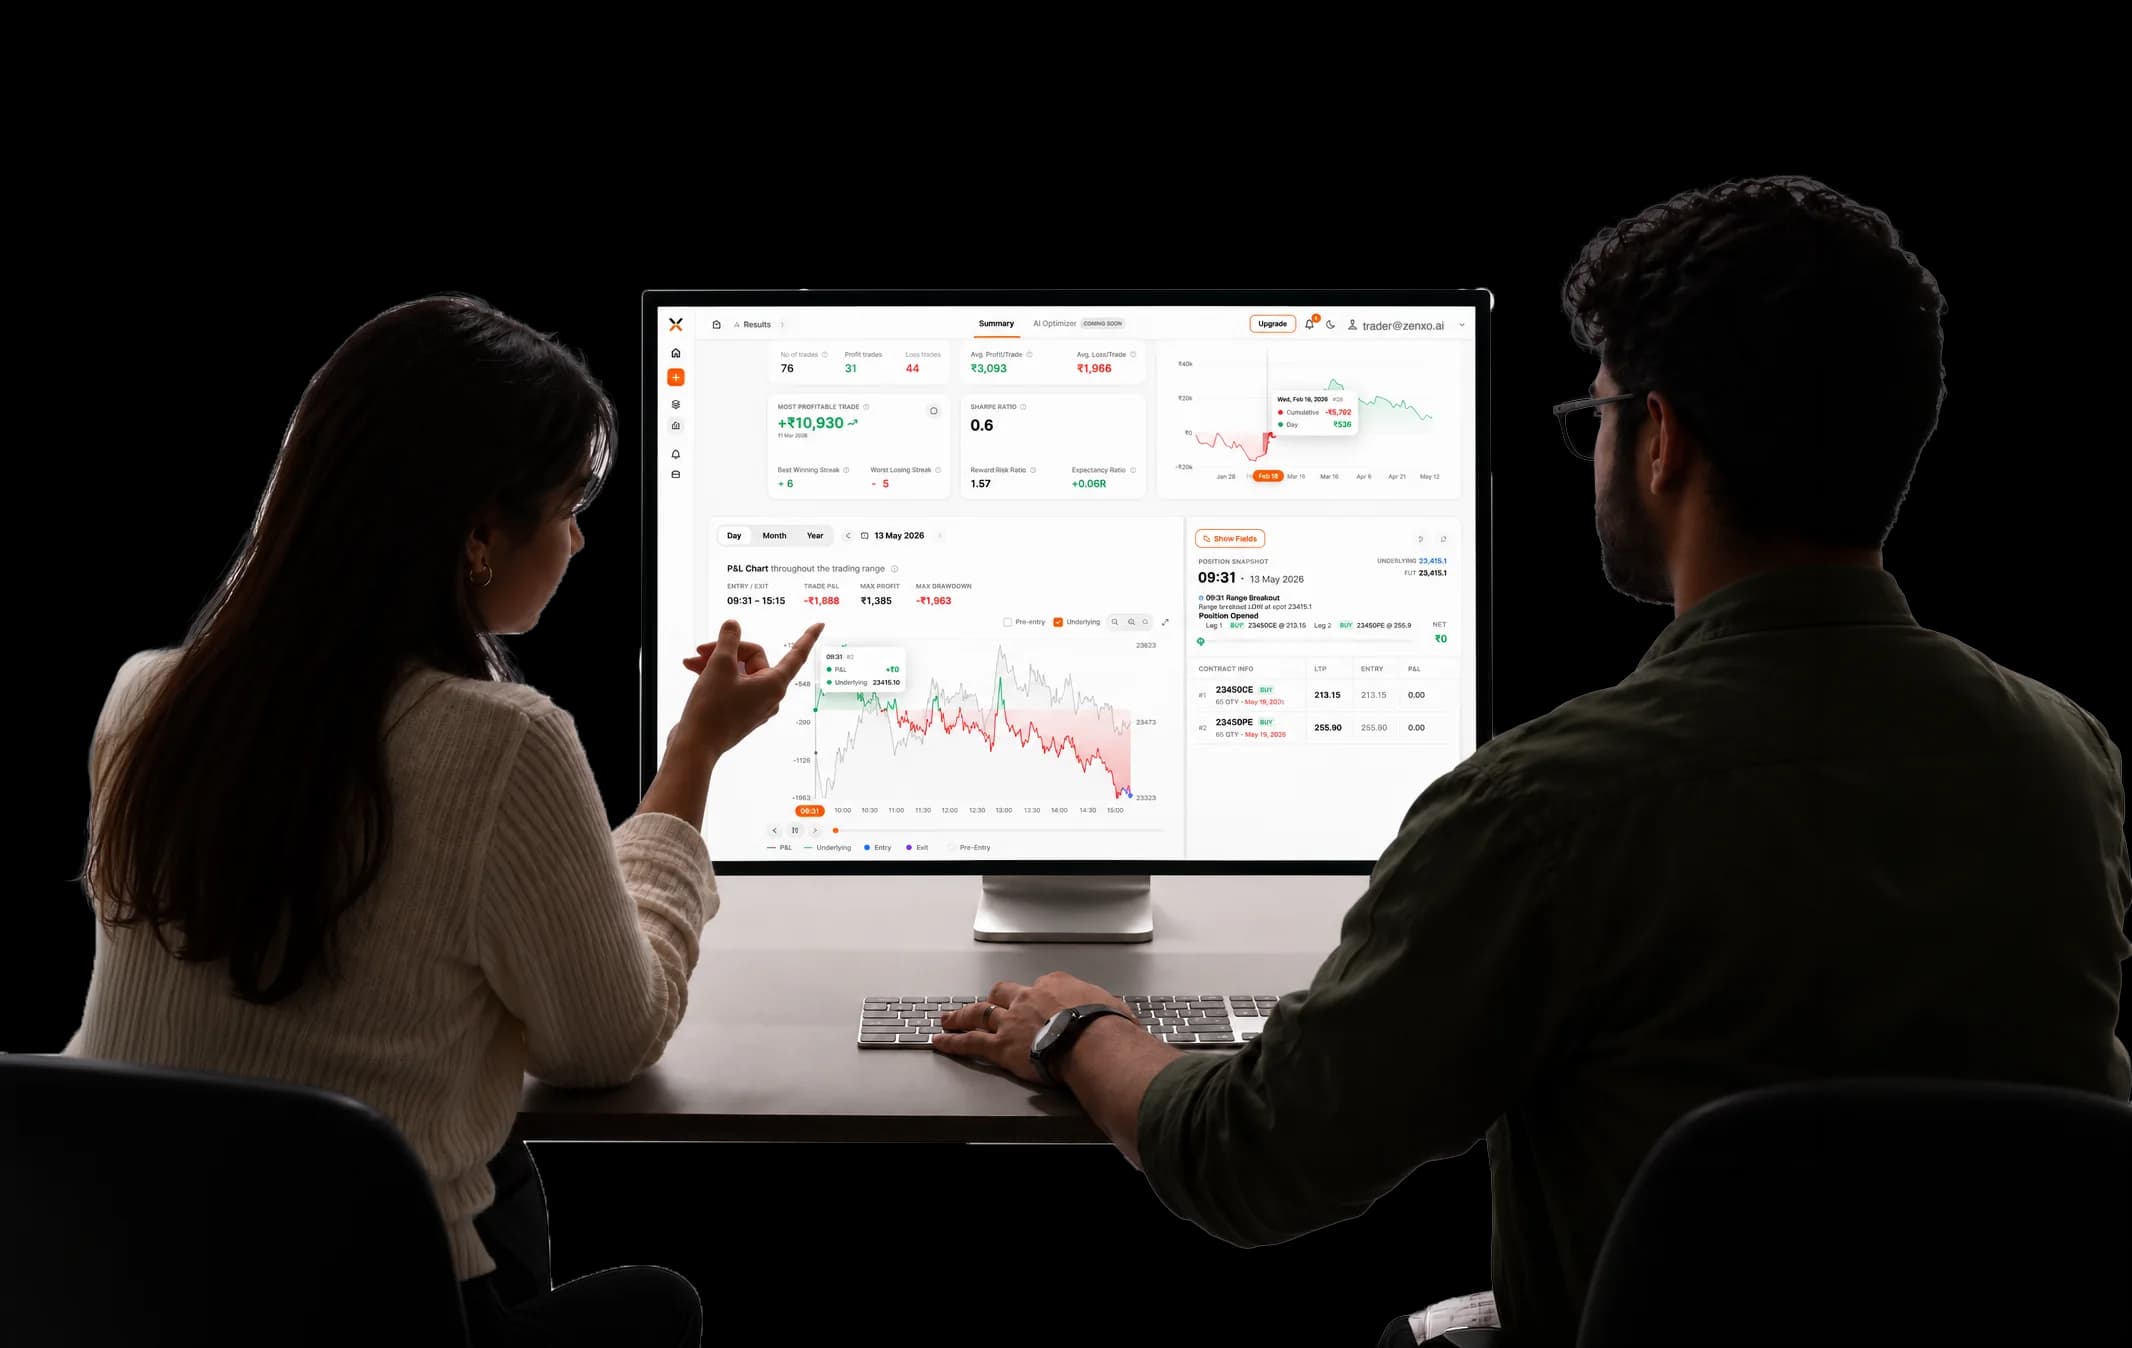
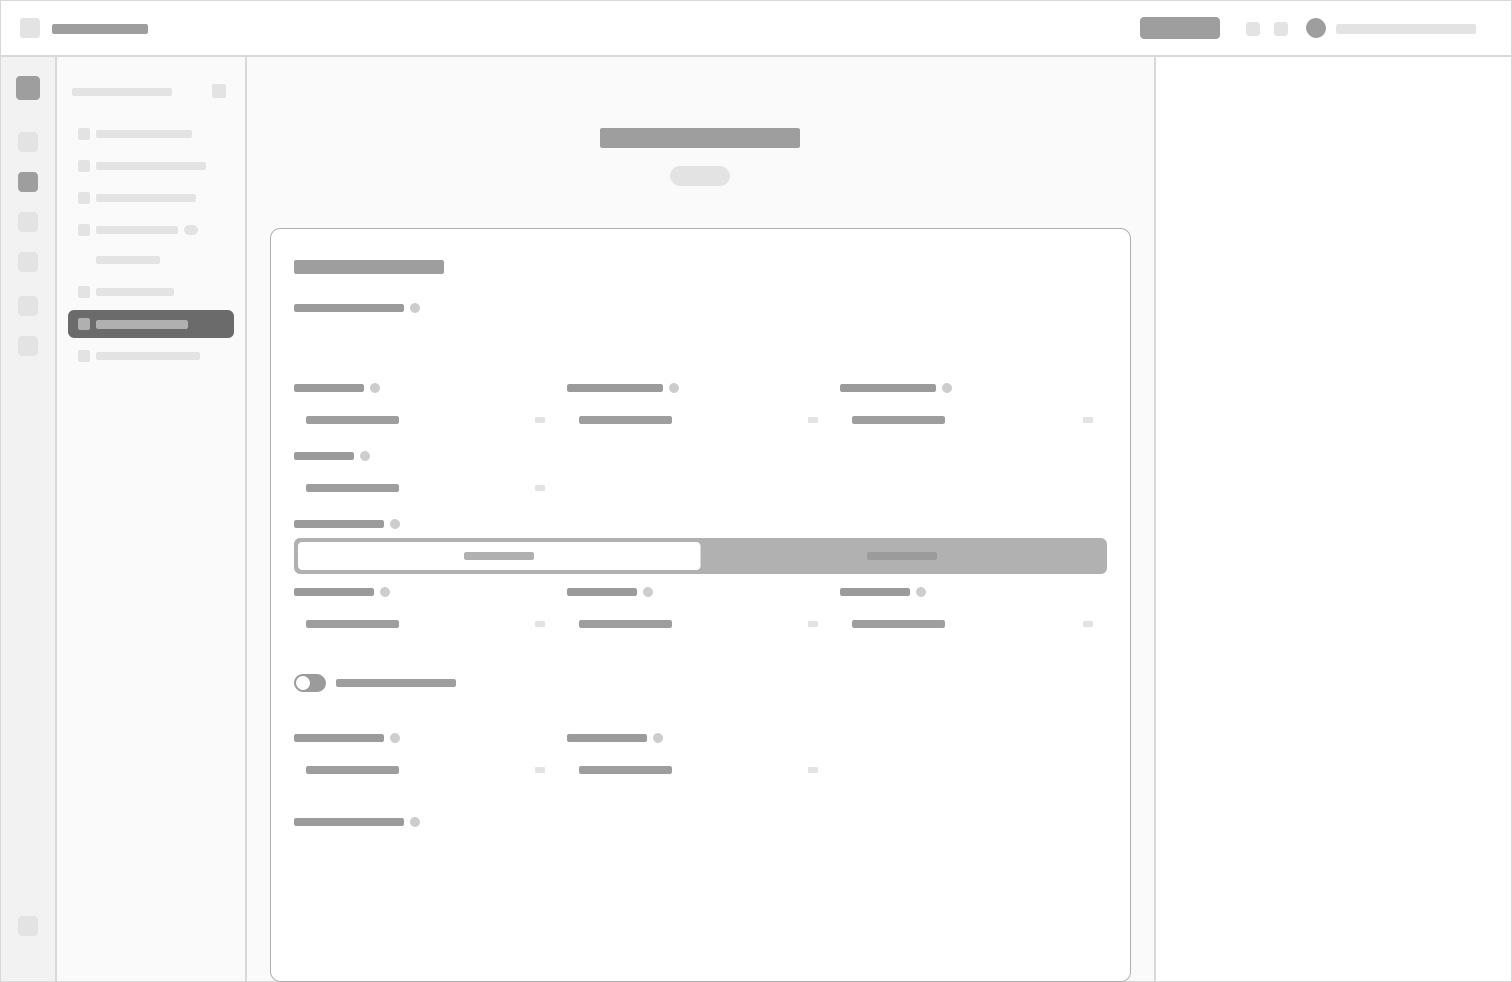
A — Editor only
Did well: Cleanest and most familiar, a real step up from the 9-section form.
Why it didn’t ship: Still couldn’t show a rule shared across legs. It listed the capability, never the relationship.
Product design · Zenxo · Shipped 2026
A canvas could show what a form never could. Keeping the form next to it is the reason traders actually learned it.

Indian retail traders build multi-leg options strategies (several buy and sell positions that work as one) and backtest them against years of market data before risking real money.
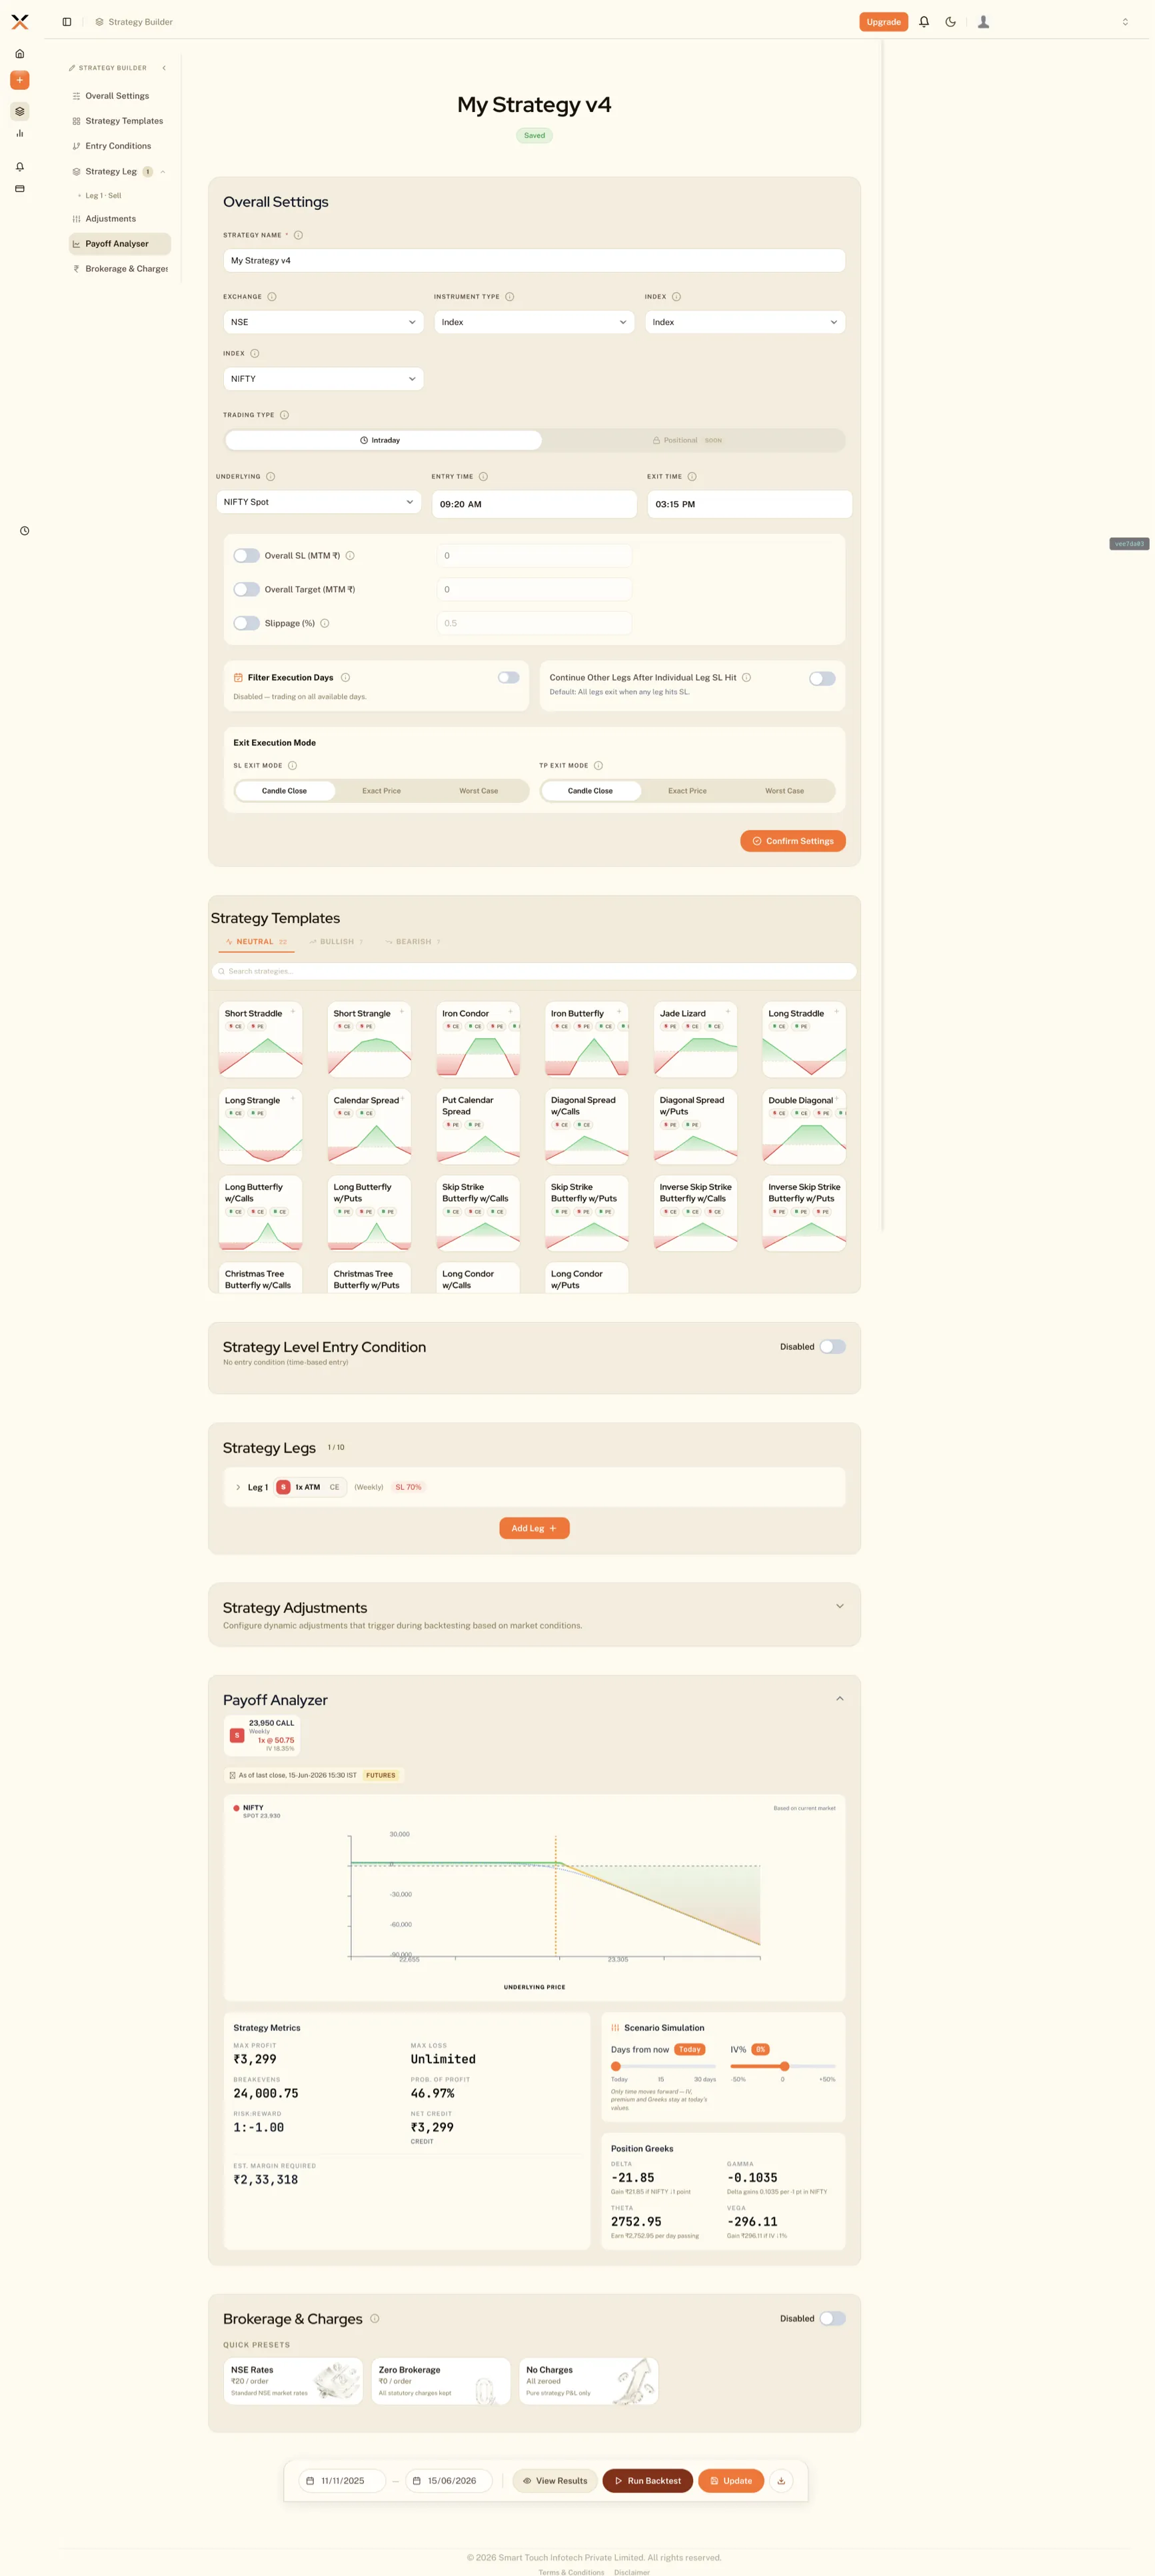
A strategy is 4 or 5 “legs.” Each leg has its own entry, stop-loss, target and re-entry rules, and some rules apply across several legs at once.
The first build put all of it into 9 form sections on one scroll: 25 controls before you’d described a single leg.
We joined a few weeks before launch, with the business unhappy about what was about to ship.
We started where you’d expect, tightening sections and fixing hierarchy. It helped, but it couldn’t touch the real problem.
A form can only list settings. It can’t hold a rule that belongs to three legs at once; that relationship turns into a checkbox that disappears the moment its panel closes.
The people on our team who trade futures and options (F&O) said it plainly: there’s no structure here, and you can’t see your own strategy.
Solution
A canvas could show what a form never could, and keeping the form beside it is why traders actually learned to read it.
We laid the strategy out the way it runs: entries on top, legs across the middle, exits below. A shared rule became one node wired to every leg it governs. That had a useful side effect: a leg with nothing beneath it is now, visibly, a leg with no exit.
Moment 1
“All of this started as three separate arguments about what a strategy builder should even be.
Exploration set — three directions, built
(Direction / what it did well / why it didn’t ship)
Did well: Cleanest and most familiar, a real step up from the 9-section form.
Why it didn’t ship: Still couldn’t show a rule shared across legs. It listed the capability, never the relationship.
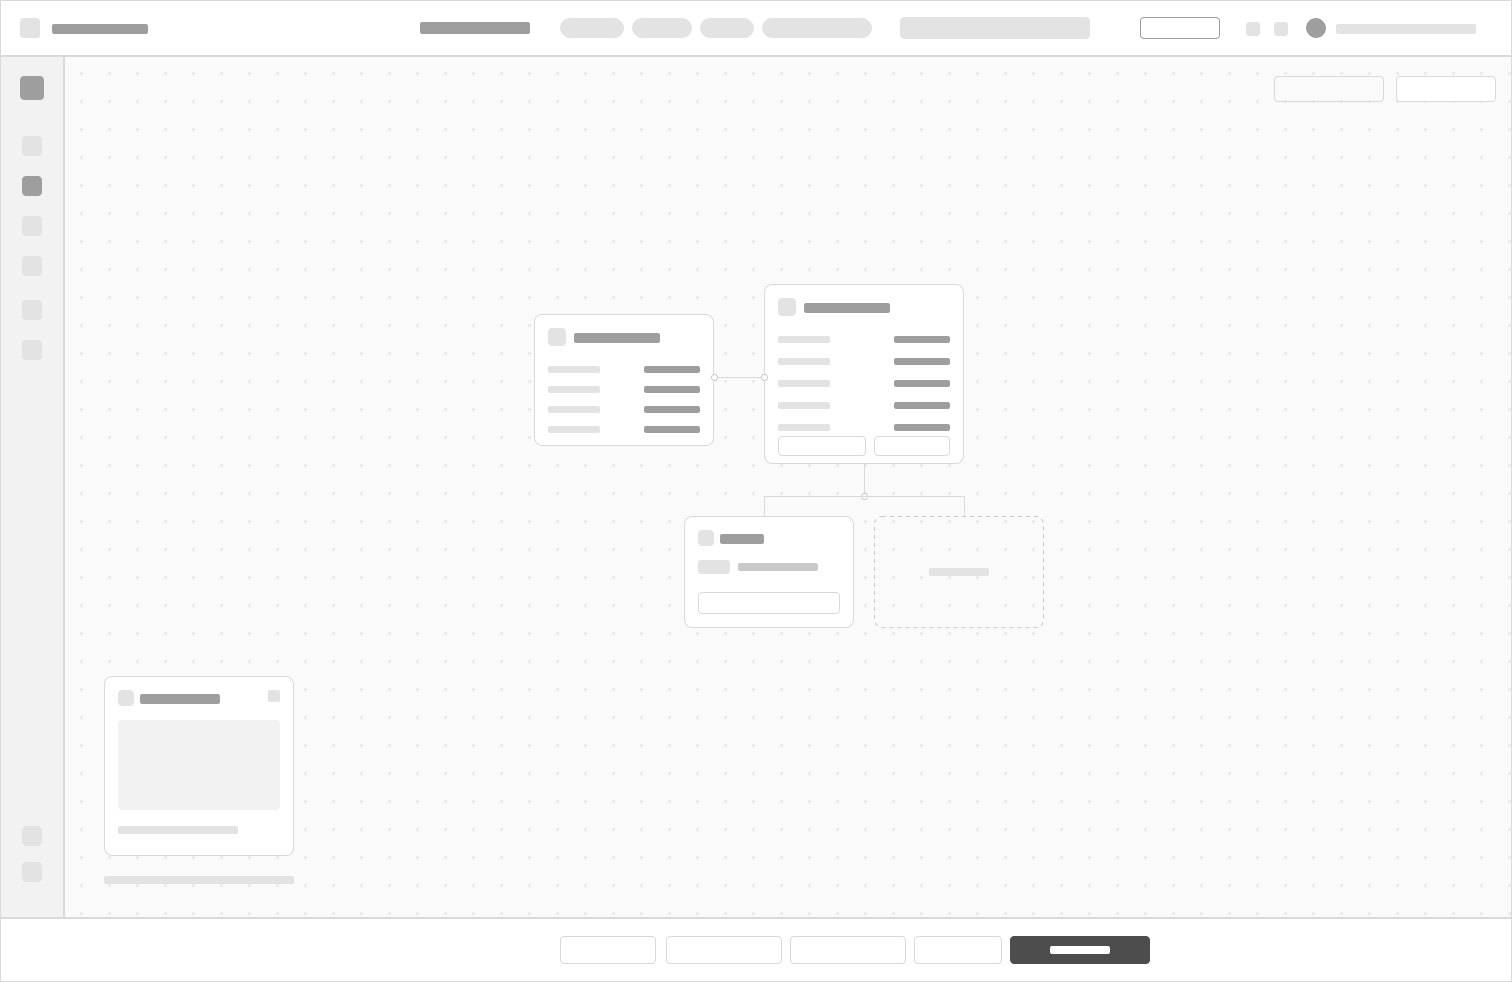
Did well: The most honest model, since a strategy really is a graph.
Why it didn’t ship: Asks a first-time trader to learn a node editor before placing a single order.
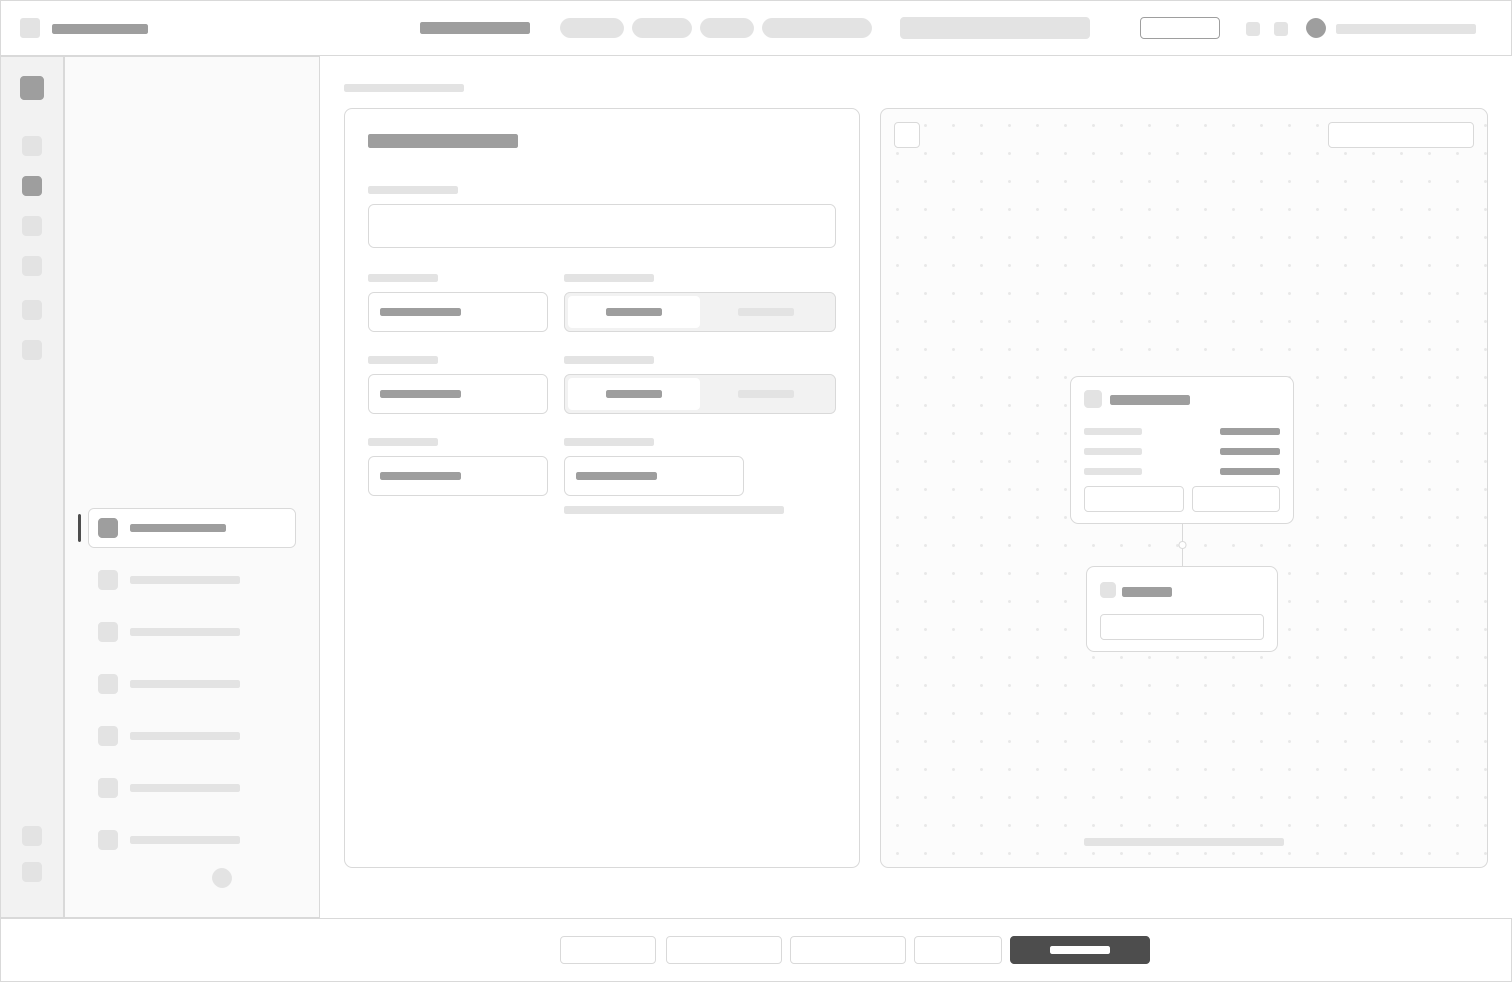
Did well: Traders start in the form they know; the canvas mirrors it live, so they learn to read it without being taught.
Cost: A narrower form column and a much harder build (two surfaces kept in sync).
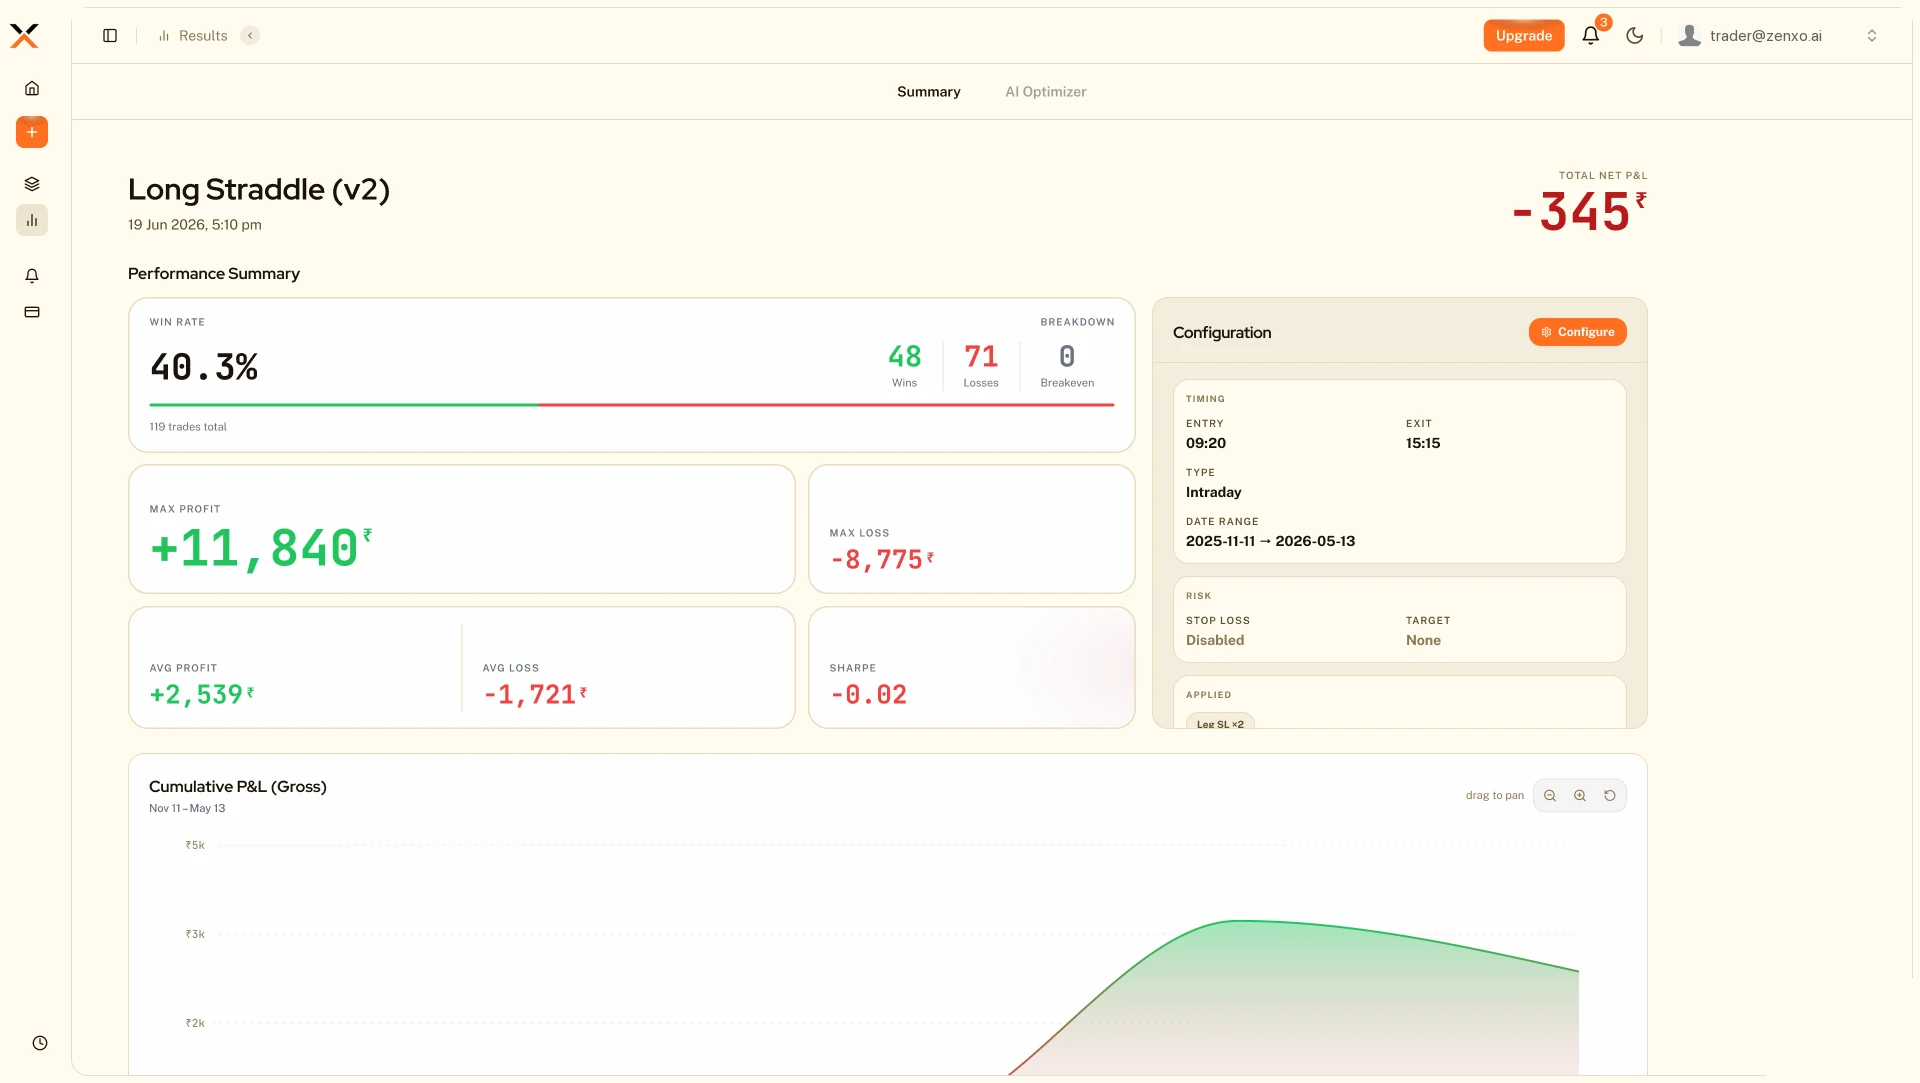
Before: everything one size, leading with a number the trader wasn't asking for.
Moment 2
The results page had 21 panels at the same weight. Net profit sat in a tile the same size as the worst losing streak. But a trader opens a backtest to answer one question: should I run this?
I sat with traders one at a time.
Priorities differed, but the shape held.
After: the verdict at display size, the curve full height on the first screen, the settings moved below. Ranking meant demoting — the settings that produced the run lost their permanent column. A deliberate trade.
Moment 3
Everything sat at one weight. The redesign trades density for rank: the verdict leads, the curve shows the shape, the legs become a table.
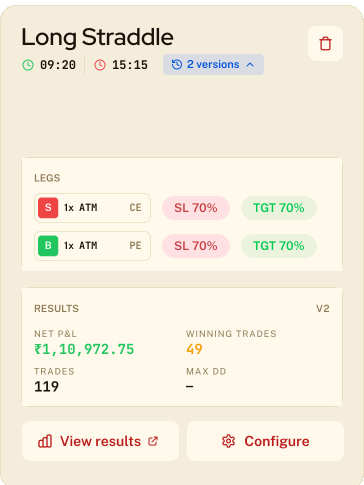
Before
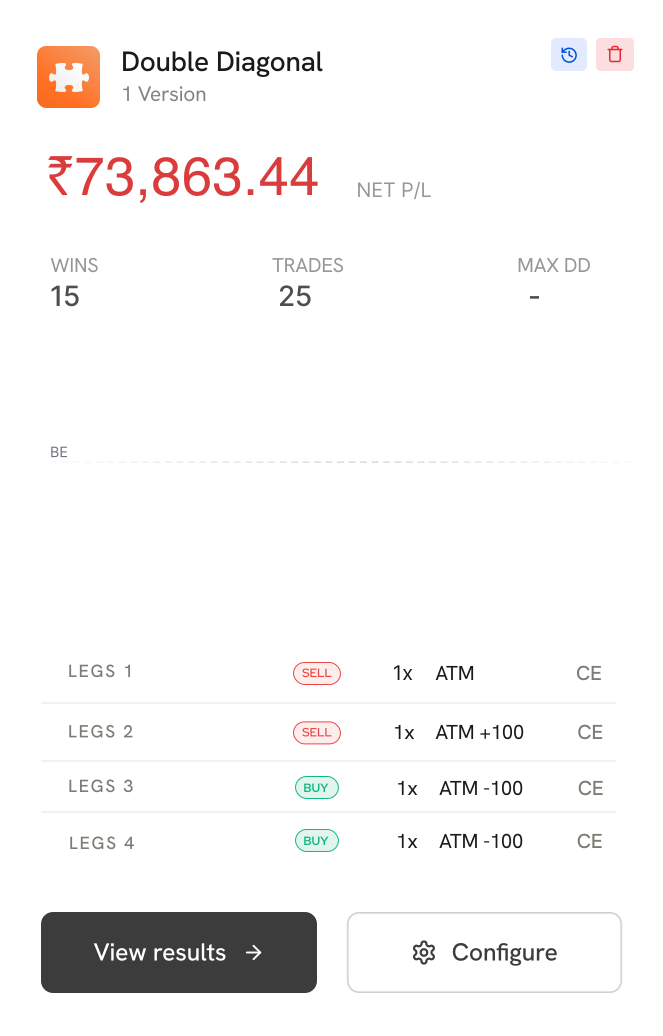
After
Moment 4
One accent colour, rationed. Orange only ever means “act here” or “you are here,” so you can read a screen without reading a word of it.
– Motion reports instead of reassuring. A backtest names the stage it’s on, so a slow run and a stuck run look different.
– If nothing is happening, nothing moves. The orbiting dots stop when the strategy stalls. That’s the whole idea in one gesture.

Double Diagonal
1 Version


A few more steps, then you’re ready to run

LEGS 1 - 4
LEGS 5 - 8
Leg 1
SELL
1x
ATM
CE
Leg 2
SELL
1x
ATM +100
CE

Configure

Double Diagonal
Version 1 | 11 Jul 2026, 3:16 PM
LIVE


Connecting Engine...
Loading Data...
Analysing Conditions...
Simulating Legs...
Computing P&L metrics...
Finalising Results...

1m 0s
·
43s left
RUNNING
Connecting Engine
Loading Data
Analysing Conditions
Simulating Legs
Computing P&L metrics
Finalising Results

Connecting Engine
Loading Data
Analysing Conditions
Simulating Legs
Computing P&L metrics
Finalising Results
Connecting Engine
Loading Data
Analysing Conditions
Simulating Legs
Computing P&L metrics
Finalising Results
Cancel

Outcomes
The rebuilt builder and the new results page both shipped. The 9-section scroll is gone, and a rule shared across several legs, which the first version couldn’t express at all, is now 1 node with its members wired to it.
Reflection
Every decision here is really a claim about what a trader needs to know before risking their money, and those weren’t claims I could make in my first few weeks. So I kept stopping to work out where a business requirement and a trader’s actual need were pulling apart, and which one should win. Each pause was reasonable on its own. Together, they pushed my tasks late, and late tasks moved the timeline for everyone downstream of me.
Understanding what I was designing for is the thing that made the work good. I’d do it again. I’d just rather not pay for it with someone else’s schedule.
Scope of work
Not done yet?
A two-day anti-bullying workshop for 33 government-school students, run with Going to School.

A conceptual rebrand of Titan, India’s iconic eyewear brand, reimagined for the athletic market.